Debugging
warning
This document has been translated using machine translation without human review.
How to open developer tools (DevTools)?
To open developer tools in an Electron application, press the F12 key or the Ctrl + Shift + I key combination in the application window.
How to reload the application/page?
Ctrl + R- normal reloadCtrl + Shift + R- hard reload
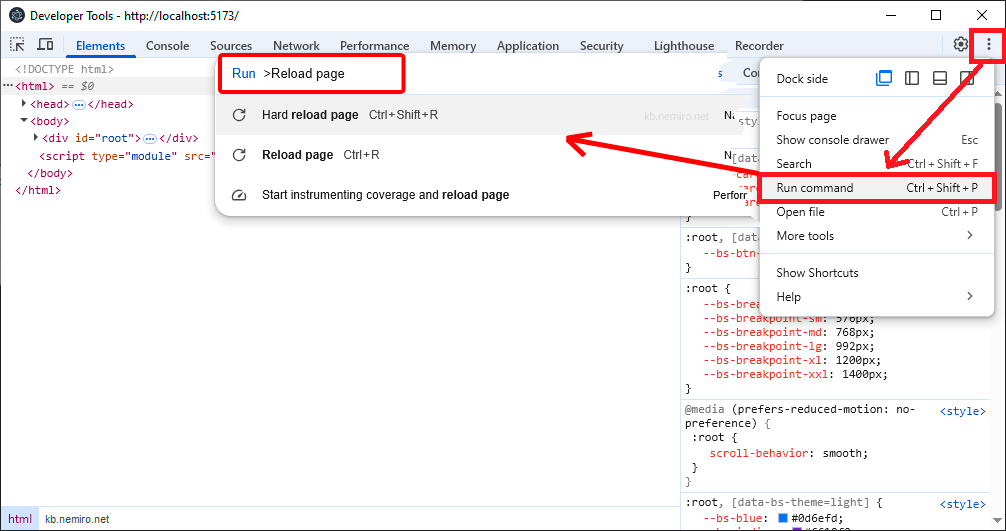
How to execute any command in developer tools?
Three dots => Run command (Ctrl + Shift + P).
In the window that appears, enter the name of the command you want to execute.
How to configure debugging in VS Code for electron-vite?
./vscode/launch.json
{
  "version": "0.2.0",
  "configurations": [
    {
      "name": "Debug Main Process",
      "type": "node",
      "request": "launch",
      "cwd": "${workspaceRoot}",
      "runtimeExecutable": "${workspaceRoot}/node_modules/.bin/electron-vite",
      "windows": {
        "runtimeExecutable": "${workspaceRoot}/node_modules/.bin/electron-vite.cmd"
      },
      "runtimeArgs": ["--sourcemap"],
      "env": {
        "REMOTE_DEBUGGING_PORT": "9222"
      }
    },
    {
      "name": "Debug Renderer Process",
      "port": 9222,
      "request": "attach",
      "type": "chrome",
      "webRoot": "${workspaceFolder}/src/renderer",
      "timeout": 60000,
      "presentation": {
        "hidden": true
      }
    }
  ],
  "compounds": [
    {
      "name": "Debug All",
      "configurations": ["Debug Main Process", "Debug Renderer Process"],
      "presentation": {
        "order": 1
      }
    }
  ]
}